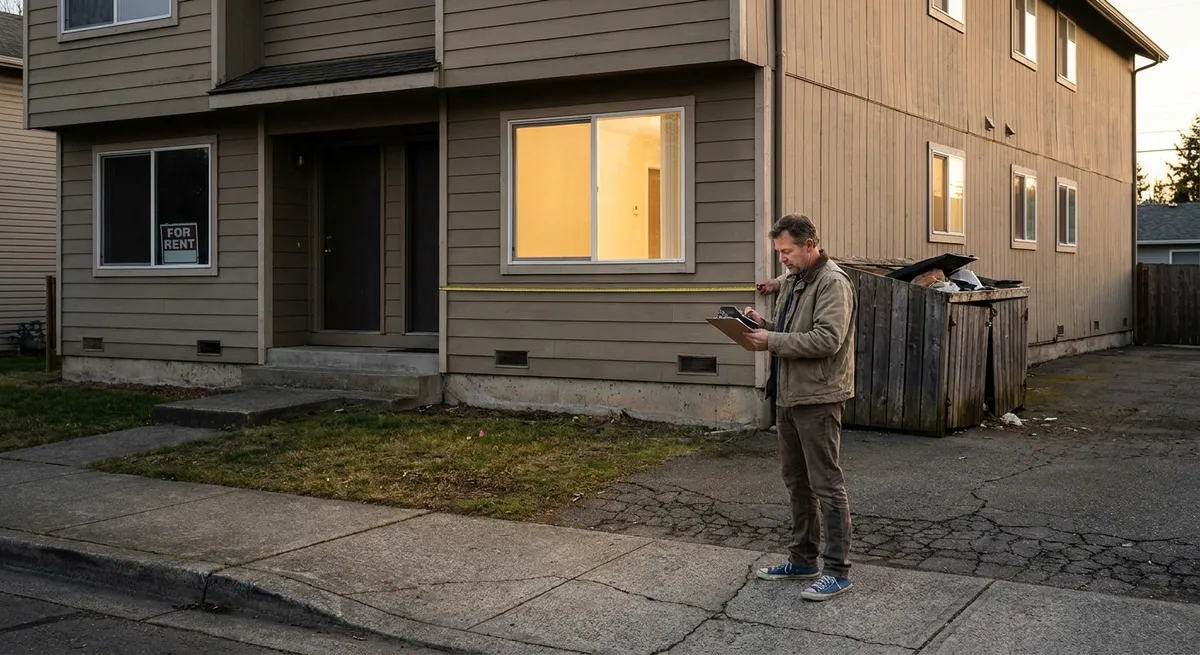
Property management is where real estate investing stops being theory and becomes operating a small business. For aspiring and active investors, the difference between a “good property” and a good investment usually comes down to disciplined management, conservative underwriting, and a sober view of risk. This article walks through the numbers, systems, and decisions that separate sustainable cash-flowing rentals from wishful thinking.
Start With the Numbers: Underwriting the Property Like a Business
Most disappointing rental outcomes start with overly optimistic underwriting. Before you think about tenants, paint colors, or “value-add,” you need a clear, rigorous view of the property’s economic engine.
Core underwriting framework
At a minimum, every deal analysis should include:
Gross Scheduled Rent (GSR) – If fully occupied at market rent
Vacancy & Credit Loss – Typically 5–10% of GSR
Effective Gross Income (EGI) – GSR minus vacancy
Operating Expenses – Taxes, insurance, repairs, management, utilities (if landlord-paid), HOA, reserves
Net Operating Income (NOI) – EGI minus operating expenses (no mortgage yet)
Capitalization Rate (Cap Rate) – NOI ÷ Purchase Price
Debt Service – Principal + interest payments
Cash Flow Before Taxes (CFBT) – NOI minus debt service
Cash-on-Cash Return (CoC) – CFBT ÷ Cash Invested
Worked example: Single-family rental
Assume:
- Purchase price: $300,000
- Down payment: 25% ($75,000)
- Loan: $225,000, 30-year fixed, 7.0% interest
- Property taxes: 1.25% of value = $3,750/year
- Insurance: $1,600/year
- Property management: 8% of collected rents
- Maintenance & capital reserves: 10% of collected rents
- Vacancy: 5% of GSR
- Monthly market rent: $2,300
Step 1: Income
- GSR = $2,300 × 12 = $27,600/year
- Vacancy (5%) = 0.05 × $27,600 = $1,380
- EGI = $27,600 − $1,380 = $26,220
Step 2: Operating expenses (excluding mortgage)
- Taxes: $3,750
- Insurance: $1,600
- Management (8% of EGI): 0.08 × $26,220 ≈ $2,098
- Maintenance & capital reserves (10% of EGI): 0.10 × $26,220 ≈ $2,622
- Miscellaneous/administrative: estimate $500
Total Operating Expenses = 3,750 + 1,600 + 2,098 + 2,622 + 500 = $10,570
Step 3: NOI & cap rate
- NOI = EGI − Operating Expenses = 26,220 − 10,570 = $15,650
- Cap Rate = 15,650 ÷ 300,000 ≈ 5.2%
Step 4: Financing and cash flow
Monthly P&I for $225,000 at 7.0% over 30 years ≈ $1,497/month
- Annual debt service ≈ $17,964
- Monthly cash flow ≈ −$193/month
CFBT = NOI − Debt Service = 15,650 − 17,964 = −$2,314/year
Step 5: Cash-on-cash return
Cash invested (simplified):
- Down payment: $75,000
- Closing costs: estimate $7,500 (2.5%)
- Initial repairs/turnover: $10,000
Total cash in ≈ $92,500
Cash-on-cash = CFBT ÷ Cash Invested = −2,314 ÷ 92,500 ≈ −2.5%
Conclusion: This is a negative cash flow deal under conservative, realistic assumptions. It might still make sense for a high-income investor targeting long-term appreciation in a strong market, but it is not a cash-flow play.
Separating Pro Forma From Reality: Common Underwriting Pitfalls
Many investors “make the deal work” on a spreadsheet by quietly underestimating risk or expenses. To avoid that trap, you need explicit assumptions and a bias toward pessimism.
Where investors routinely under-budget
Vacancy
- Pro forma: 0–3% to “make the numbers work” - Reality: 5–8% is common; higher for C-class areas or heavy value-add - Adjust up if: weak demand, seasonal markets, student rentals, or poor location
Maintenance & CapEx
- Rule-of-thumb ranges: - Newer properties: 5–8% of rent - Older (30+ years): 10–15%+ of rent - Major items: roofs, HVAC, plumbing, parking lots, windows, appliances
Property management
- Typical: 7–10% of collected rents, plus leasing fees (often 50–100% of one month’s rent) - Don’t ignore: lease-up fees, renewal fees, maintenance coordination markups
Property taxes
- Often jump after sale due to reassessment - Check actual tax assessor data and expected reassessment rules in that jurisdiction
Insurance
- Significant increases in some states (e.g., coastal, wildfire, hail-prone regions) - Get a real quote for the property type and location; don’t reuse old assumptions
Turnover and make-ready costs
- Cleaning, paint, flooring, small repairs, lost rent - For mid-tier rentals, $1,000–$3,000 per turn is common; higher if heavy wear
Quick “does this even deserve a deep dive?” filters
- 1% Rule (very rough): Monthly rent ≈ 1% of purchase price
- In many higher-priced markets this no longer holds, but if you’re below 0.6–0.7%, it will be hard to cash flow unless expenses are unusually low.
- Debt Service Coverage Ratio (DSCR): NOI ÷ Debt Service
- Healthy: 1.25x+
- Marginal: 1.10–1.20x
- Below 1.0x: negative cash flow
Use these as screening tools, not final decision criteria.
When the Deal Doesn’t Pencil: A Multifamily Case Study
Consider a small 4-unit multifamily in a secondary market.
Property snapshot
- Purchase price: $600,000
- 4 units renting at $1,400/month each
- Current owner self-managing, low reported expenses
- You plan to use professional management
Step 1: Income
- GSR = 4 × $1,400 × 12 = $67,200
- Vacancy (7% for small multi): 0.07 × 67,200 = $4,704
- EGI ≈ $62,496
Step 2: Operating expenses
Assume:
- Taxes: $6,500/year
- Insurance: $3,500/year
- Water/sewer/garbage (landlord-paid): $4,800/year
- Lawn/snow/cleaning: $1,800/year
- Management: 8% of EGI ≈ 0.08 × 62,496 = $5,000
- Repairs & maintenance: 8% of EGI ≈ $5,000
- Capital reserves: 7% of EGI ≈ $4,375
Total Operating Expenses ≈ 6,500 + 3,500 + 4,800 + 1,800 + 5,000 + 5,000 + 4,375 = $30,975
NOI = 62,496 − 30,975 = $31,521
Cap Rate = 31,521 ÷ 600,000 ≈ 5.3%
Step 3: Financing
Assume:
- 25% down: $150,000
- Loan: $450,000, 7.0% interest, 25-year amortization
- Monthly P&I ≈ $3,181, annual ≈ $38,172
- Monthly ≈ −$554
CFBT = 31,521 − 38,172 = −$6,651/year
On a $150,000 (plus closing/repairs) cash investment, cash-on-cash is meaningfully negative.
Is there a path to “fixing” the deal?
Potential levers:
- Raise rents to $1,600/unit (if market supports):
- New GSR = 4 × 1,600 × 12 = 76,800
- EGI (after 7% vacancy) ≈ $71,424
- Assume similar expense ratio (~49.6% from previous): Operating Expenses ≈ 0.496 × 71,424 ≈ $35,436
- New NOI ≈ 71,424 − 35,436 = $35,988
- CFBT ≈ 35,988 − 38,172 = −$2,184/year
Even with a $200/month rent bump per unit (if achievable), the deal is still slightly negative. You’d need both higher rents and/or a lower purchase price, or cheaper financing, to make this worth the risk for a cash-flow investor.
This is what “the deal doesn’t pencil” looks like numerically: no reasonable combination of realistic rents and conservative operating assumptions produces acceptable returns.
Financing Scenarios: How Loan Terms Change the Story
The same property can be good or bad depending on leverage and rates. You should explicitly model different structures and understand how each affects risk.
Example: Changing LTV and interest rate
Using the earlier single-family example ($300,000 purchase), compare scenarios:
Scenario A: 75% LTV at 7.0%
- Loan: $225,000
- P&I: ≈ $1,497/month
- Annual debt service: ≈ $17,964
- CFBT: −$2,314/year (≈ −$193/month)
- Cash invested: ≈ $92,500
- CoC: ≈ −2.5%
Scenario B: 60% LTV at 7.0%
- Loan: $180,000
- P&I: ≈ $1,197/month
- Annual debt service: ≈ $14,364
- Cash invested: add $45,000 to equity (down payment now $120,000)
- New total cash in ≈ $137,500
- CFBT = 15,650 − 14,364 = $1,286/year (≈ $107/month)
- CoC ≈ 1,286 ÷ 137,500 ≈ 0.9%
You turned negative cash flow into slightly positive by reducing leverage, but your return on cash remains weak.
Scenario C: 75% LTV, 5.0% interest (older rate environment or rate buy-down)
- Loan: $225,000
- P&I at 5.0%, 30-year: ≈ $1,207/month
- Annual debt service: ≈ $14,484
- CFBT = 15,650 − 14,484 = $1,166/year (≈ $97/month)
- Cash in: ≈ $92,500
- CoC ≈ 1,166 ÷ 92,500 ≈ 1.3%
Rates matter, but even a significant rate improvement doesn’t transform a fundamentally thin deal into a robust performer. Underwriting should assume today’s rates, not nostalgic ones.
Operating the Asset: Property Management as Risk Control
Once you own the property, property management is less about squeezing every dollar and more about systematically controlling downside risk: vacancies, bad debt, property damage, and regulatory issues.
Core pillars of effective property management
Tenant screening and selection
- Standard, written criteria: income multiple (e.g., 3x rent), credit thresholds, rental history, criminal background per local law - Verify everything: pay stubs, employer, prior landlords (not just current one)
Leasing and rent setting
- Use current comps: MLS data, online rental platforms, local property managers - Don’t chase top-of-market at the expense of quality tenants and longer vacancy
Maintenance systems
- Preventive maintenance schedule (HVAC servicing, gutter cleaning, etc.) - Clear process: how tenants submit requests, response time standards - Document everything with photos and work orders for future disputes or sales
Financial controls
- Separate bank accounts per property or entity - Monthly P&L and cash flow statements - Track per-unit operating expenses and benchmark against similar assets
Legal and compliance
- Fair housing laws (federal, state, and local) - Landlord-tenant statutes: notice periods, security deposit rules, habitability standards - Eviction process timelines and costs in your jurisdiction
The goal is to create a repeatable operating system that reduces surprises and makes your properties easier to own, not just profitable on paper.
Risk Factors Investors Ignore Until It’s Too Late
Even a deal that pencils well on day one can fail if you ignore key risks. A good property management plan systematically mitigates these.
Key risk categories
Concentration risk
- Heavy exposure to one submarket, employer base, or property type - Example: all rentals near one university; policy changes or enrollment drops can hit you hard
Regulatory and political risk
- Rent control, eviction moratoriums, new licensing or inspection requirements - Some cities are moving toward stricter tenant protections; underwrite the risk that regulation becomes less landlord-friendly over time
Construction and CapEx risk
- Hidden defects: structural, sewer lines, electrical, environmental issues - Cost overruns on rehab due to contractor issues, permits, or code upgrades
Liquidity and refinancing risk
- Balloon loans or short-term debt in a rising rate environment - Plan for exit or refinance before maturity dates are close
Market rent risk
- Assuming perpetual rent growth; realistic underwriting should allow for flat or modestly negative rent scenarios in downturns
Due Diligence Checklist: Before You Close a Deal
Due diligence is where you attempt to eliminate “unknown unknowns” and convert them into quantifiable risks you can accept—or walk away from.
Physical due diligence
- Full home inspection (licensed), plus:
- Roof age and condition
- HVAC age, service history
- Plumbing type (e.g., galvanized, polybutylene) and sewer scope
- Electrical panel type and capacity (e.g., knob-and-tube, Federal Pacific panels)
- Environmental red flags: flood zone, radon, lead paint, asbestos (older buildings)
Financial due diligence
- Last 12–24 months of:
- Rent rolls
- Bank statements (to verify actual collections)
- Operating statements and utility bills
- Property tax bills and notices of reassessment
- Compare seller’s expenses to your pro forma; if they’re unusually low, assume you’re the one who’s right, not them.
Legal and compliance
- Title search; check for liens, code violations, open permits
- Zoning verification (are current uses grandfathered or legal?)
- Review leases:
- Terms, renewals, security deposits
- Illegal or unusual clauses
- Rent concessions or side agreements
Market and management
- Rent comps from at least 3 credible sources
- Crime maps and police data, not just “vibe checks”
- Talk to two or more property managers about realistic rents, vacancy, and tenant profile for that asset class
If the seller resists providing documentation or rushes you to close, treat it as a data point about the risk profile of the deal.
A Simple Framework for Go/No-Go Decisions
To keep emotions out of the decision, define your criteria before you analyze the property.
Examples of objective thresholds:
- Minimum cash-on-cash return: e.g., 6–8%+ at stabilized operations
- Minimum DSCR: 1.25x+ under conservative assumptions
- Maximum rehab budget as a percentage of purchase price: e.g., <30%
- Required cash reserves post-closing: e.g., 6–12 months of PITI and operating expenses
- If any of these fail by a wide margin, you:
- Either walk, or
- Renegotiate price/terms until the deal meets your criteria
The discipline is not in complex spreadsheets; it’s in being willing to say “no” when the numbers don’t align with your written standards.
Conclusion
Property management for investors is not about squeezing a few extra dollars of rent, nor is it about chasing maximum leverage and theoretical appreciation. It’s about consistently applying conservative math, realistic assumptions, and disciplined operations.
The best deals usually don’t look spectacular in year one—they look robust: reasonable returns under conservative underwriting, resilient to vacancy or expense shocks, and supported by systems that make ownership sustainable. If you treat each property like a small operating business—underwritten carefully, managed professionally, and reviewed regularly—you dramatically increase your odds of long-term success while avoiding the “it looked great in the spreadsheet” trap.
Sources
- HUD: Fair Housing Laws and Regulations - Official overview of federal fair housing regulations relevant to tenant screening and management
- FDIC: Commercial Real Estate and Loan Structuring - Explains key credit metrics like DSCR and underwriting considerations for income-producing property
- US Census Bureau: Housing Vacancies and Homeownership - Provides vacancy rate data useful for setting realistic vacancy assumptions in underwriting
- Harvard Joint Center for Housing Studies: America’s Rental Housing Reports - In-depth research on rental markets, operating costs, and demographic trends
- Insurance Information Institute: Homeowners and Property Insurance - Background on property insurance trends and factors affecting premiums