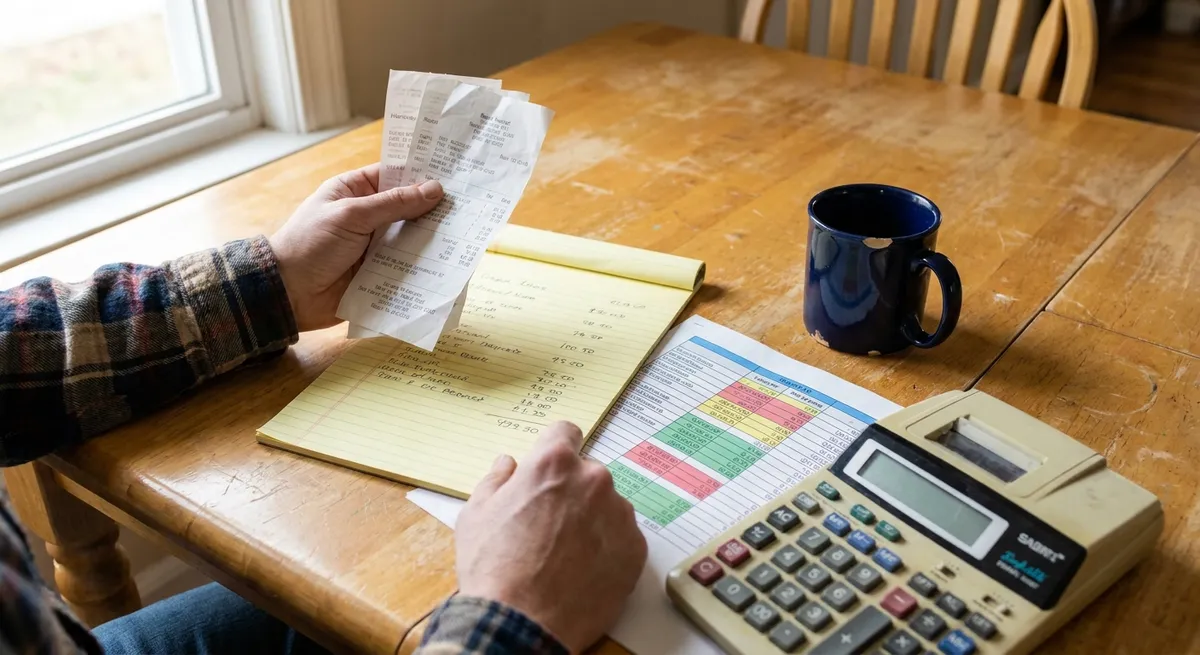
Most advice on rental properties jumps straight to “cash flow!” without doing the math. At Brick Yield Lab, we care less about hype and more about what your spreadsheet says after debt service, repairs, and realistic vacancy. This guide walks through concrete, numbers-driven examples so you can see when a rental is a solid investment—and when to walk away.
Start With the Yield, Not the Wallpaper
Before falling in love with a property, you need a framework for evaluating it. At minimum, you should be able to answer:
- What is the gross yield (rent ÷ purchase price)?
- What is the net yield (net operating income ÷ purchase price)?
- What is the cash-on-cash return (annual cash flow ÷ cash invested)?
- How sensitive is the deal to changes in rent, interest rates, taxes, or repairs?
A disciplined investor underwrites a property using conservative assumptions and then tries to disprove the deal. If the numbers still look decent after stress-testing, only then does it deserve serious consideration.
A simple hierarchy for evaluating:
Neighborhood economics (jobs, population, income trends)
Building fundamentals (condition, layout, major systems)
Numbers under conservative assumptions (not best-case)
Fit with your capital, risk tolerance, and management capacity
Most “bad” rental deals don’t fail because of unforeseen black swans; they fail because the buyer never did a sober underwriting in the first place.
Example 1: A Basic Single-Family Rental, Fully Underwritten
Scenario:
- Purchase price: $250,000
- Market rent: $2,000/month
- Location: Stable, middle-income suburb
- Strategy: Long-term single-family rental
Step 1: Gross Yield
Gross annual rent = $2,000 × 12 = $24,000
Gross yield = $24,000 ÷ $250,000 = 9.6%
A 9.6% gross yield looks attractive at first glance, but gross yields ignore all operating costs.
Step 2: Operating Expenses (Conservative Assumptions)
Assume:
- Property taxes: 1.2% of value = $3,000/year
- Insurance: $1,200/year
- Maintenance/CapEx: 10% of rent = $2,400/year
- Property management: 8% of rent = $1,920/year
- Vacancy: 5% of rent = $1,200/year
- Utilities: Tenant pays all (so $0 here, but that’s not always the case)
Operating expenses total:
- Taxes: $3,000
- Insurance: $1,200
- Maintenance/CapEx: $2,400
- Management: $1,920
- Vacancy reserve: $1,200
Total operating expenses = $9,720/year
Net Operating Income (NOI) = Gross rent – Operating expenses
= $24,000 – $9,720 = $14,280
Net yield = NOI ÷ purchase price
= $14,280 ÷ $250,000 ≈ 5.7%
This is before financing. Now we layer in debt.
Step 3: Financing Scenario (30-Year Fixed)
Assume:
- Down payment: 25% = $62,500
- Loan amount: $187,500
- Interest rate: 7.0%
- Amortization: 30 years
Using a standard mortgage calculator, payment at 7.0% for 30 years on $187,500 is about $1,248/month = $14,976/year (principal + interest).
Now compare to NOI:
- NOI: $14,280
- Annual debt service: $14,976
Annual cash flow before tax = NOI – debt service
= $14,280 – $14,976 = –$696
So you are slightly negative on cash flow in year one, even though gross yield was almost 10%.
Cash-on-cash return (year 1, purely cash flow) = –$696 ÷ $62,500 ≈ –1.1%
This is a classic case where a property appears strong at the gross-rent level but provides marginal or negative cash flow once realistic expenses and current rates are applied.
Is This a Bad Deal?
Not necessarily; it depends on your objectives:
- If you need positive cash flow from day one, this fails.
- If your focus is long-term wealth, you might accept near-breakeven cash flow in a strong, appreciating market with good tenant quality.
You’d want to ask:
- Can you negotiate the purchase price down (e.g., to $230,000)?
- Will rents reasonably rise (e.g., 2–3%/year) without stretching affordability?
- Is 7.0% really your best rate, or do you qualify for slightly better?
But the spreadsheet is clear: this is not a “cash flow machine”; it’s a long-term, equity-and-appreciation play at best.
Example 2: When a “High-Rent” Duplex Still Doesn’t Work
Scenario:
- Small duplex in a working-class neighborhood
- Purchase price: $350,000
- Each unit rents for $1,400/month
- Total rent: $2,800/month ($33,600/year)
Step 1: Gross Yield
Gross yield = $33,600 ÷ $350,000 ≈ 9.6% (similar to Example 1).
Step 2: Operating Expenses (Higher for Small Multifamily)
Assume:
- Property taxes: 1.4% = $4,900/year (rounded)
- Insurance: $1,800/year (multifamily is pricier)
- Maintenance/CapEx: 12% of rent (older building) = $4,032/year
- Property management: 8% of rent = $2,688/year
- Vacancy: 8% (more turnover with lower-income tenants) = $2,688/year
- Owner-paid utilities (water & trash): $1,800/year
Total operating expenses:
- Taxes: $4,900
- Insurance: $1,800
- Maintenance/CapEx: $4,032
- Management: $2,688
- Vacancy: $2,688
- Utilities: $1,800
Total = $17,908/year
NOI = $33,600 – $17,908 = $15,692
Net yield = $15,692 ÷ $350,000 ≈ 4.5%
Step 3: Financing at Today’s Rates
Assume:
- Down payment: 25% = $87,500
- Loan amount: $262,500
- Rate: 7.25%
- Term: 30 years
Approximate monthly payment at 7.25%: ≈ $1,786/month = $21,432/year
Cash flow = NOI – debt service
= $15,692 – $21,432 = –$5,740/year (about –$478/month)
Cash-on-cash = –$5,740 ÷ $87,500 ≈ –6.6%
Even with what looks like strong gross rents, the debt service crushes the deal at current interest rates and operating costs. For this to work as a cash-flow investment, something material must change:
- Price: At $280,000 instead of $350,000, NOI unchanged at $15,692; loan drops, and cash flow improves dramatically.
- Rent: If each unit could plausibly rent for $1,700 instead of $1,400, gross income shifts meaningfully (but so might vacancy or delinquency risk).
- Financing: A significantly lower rate (e.g., owner-occupied house hack at 5–6%) can change the math.
As it stands, this duplex is fundamentally mispriced for a leveraged investor who needs cash flow. The right move is often to walk away rather than rationalize it.
Reading the Return Stack: Cash Flow, Equity, and Risk
Rental properties can pay you in several ways:
Cash flow (monthly spread after all expenses and debt)
Principal paydown (tenants gradually paying off your loan)
Appreciation (market value increases)
4. Tax benefits (depreciation, interest deductions, etc., depending on your jurisdiction and status)
A disciplined investor evaluates each layer and does not “backfill” bad cash flow with speculative appreciation.
Using Example 1 (single-family):
- Cash flow: –$696/year
- Principal paydown (year 1 at 7%): roughly $2,000–$2,500 of your mortgage payment is principal
- Appreciation assumption: Say 3%/year = $7,500 paper gain
- Total “economic benefit” ≈ –$696 + $2,250 + $7,500 ≈ $9,054
On a $62,500 cash investment, that’s a paper return of ~14.5%. But note:
- Appreciation is not guaranteed.
- Liquidity is low—you cannot easily access all of that value.
- You’re subsidizing the asset with slightly negative cash flow.
Some investors are comfortable with this if the location is strong and they have stable personal income. Others prefer positive cash flow as a margin of safety. Both approaches can be rational; neither should be confused with a risk-free path.
Stress-Testing Your Deal: What If Things Go Wrong?
Before committing, build a simple stress test with at least three scenarios:
- Base Case: Your conservative best estimate.
Downside:
- Rents 5–10% lower than expected - 2–3 months of vacancy in first year - One unexpected major repair within 3 years (e.g., $7,000 roof)
Upside:
- Rents tick up slightly faster - Stable long-term tenants - No major CapEx in first 5 years
Questions to ask under your downside case:
- Are you still able to cover the mortgage, taxes, and insurance with your personal income if needed?
- Does the property still align with your goals if there is no appreciation for 5–7 years?
- Can you fund major CapEx (roof, HVAC, plumbing) without distress?
If a small rent drop or one tenant turnover breaks your entire model, the deal is too fragile.
Due Diligence Checklist for Rental Properties
Thorough due diligence turns unknown risks into either known costs (which you can price in) or deal-breakers.
1. Property-Level Due Diligence
- Inspection reports: General inspection plus specialists for roof, foundation, HVAC, sewer if older.
- Age of major systems: Roof, windows, electrical, plumbing, HVAC, water heater.
- Code compliance: Check permits for past work; verify no open violations.
- Utility structure: Who pays what (water, sewer, trash, gas, electric)? Shared meters?
- Floor plan and functionality: Bedroom count, egress, parking adequacy.
Red flag example: A “cheap” duplex where the sewer line is clay and failing can require a $10,000–$20,000 replacement, which may wipe out several years of cash flow.
2. Financial Due Diligence
- Actual rent roll: Current leases, duration, security deposits.
- Historical expenses (2–3 years if available): Taxes, insurance, utilities, repairs.
- Tax assessment trajectory: Has the property recently traded? Could purchase price trigger reassessment and higher taxes?
- Insurance quotes: Get your own quote; don’t rely on seller’s historical premium.
If your underwriting uses “rules of thumb” (e.g., 10% maintenance) but actuals show 20% over several years, adjust your model upward.
3. Market and Regulatory Due Diligence
- Local vacancy and rent trends: Use multiple sources (brokers, property managers, listings).
- Zoning and future development: New supply, infrastructure changes, or major employers entering/leaving.
- Landlord-tenant laws: Eviction timelines, rent-control ordinances, habitability standards, licensing requirements, security deposit rules.
In highly tenant-protective jurisdictions, assume longer eviction timelines and potential legal costs. This is not inherently “bad,” but it must be priced into your risk/return calculus.
When a Deal Does Not Pencil Out (And That’s a Win)
A mature investor often “wins” by walking away. Some common reasons:
- Net yield is too thin: After expenses, NOI gives you <4–5% net yield in a non-prime area.
- Debt service coverage is inadequate: Debt Service Coverage Ratio (DSCR) < 1.2 (NOI ÷ debt service), leaving no cushion.
- CapEx iceberg: Inspections reveal a stack of near-term replacements: roof, HVAC, windows, and electrical.
- Regulatory headwinds: Pending rent caps or restrictive ordinances that constrain future income.
- Overly optimistic pro forma: Broker pitch assumes rent increases well above local income growth or current market.
Example: For the duplex at $350,000, if your best realistic renegotiated price is $330,000 and interest rates are unlikely to drop soon, the model may still show persistent negative cash flow with only modest long-term upside. Passing is not failure; it’s capital preservation.
Putting It All Together: A Simple Evaluation Framework
For each rental opportunity, run through:
Fundamentals Check
- Stable or improving area? - Legal, functional, and insurable building?
Net Yield and DSCR
- Net yield (NOI ÷ price) appropriate for the risk profile? - DSCR ≥ 1.25 under conservative assumptions?
Cash Flow and Downside Tolerance
- Is cash flow comfortably positive, breakeven, or slightly negative? - Can you cover a 6–12 month stress scenario out-of-pocket?
Return Stack Clarity
- Are you relying primarily on appreciation or on cash flow? - Is this consistent with your income, time horizon, and risk tolerance?
Exit Strategy
- If you needed to sell in 3–5 years, who is your likely buyer (owner-occupant, investor)? - Could you refinance if rates move favorably?
If a property passes these filters—and your spreadsheet still looks reasonable after you’ve tried to kill the deal—you’re closer to a truly investable rental, not just a hopeful story.
Conclusion
Successful rental investing is less about finding magic deals and more about disciplined underwriting, conservative assumptions, and patience. The same property can be wise for a high-income, long-term investor and unsuitable for someone who needs immediate cash flow. Your job is to model the numbers honestly, stress-test the downside, and walk away from anything that only works under perfect conditions.
Brick Yield Lab’s lens is straightforward: rentals should be treated like small businesses. They have revenue, operating costs, capital expenditures, financing costs, and regulatory risks. When you see them clearly on paper, you’ll discover that many “great deals” aren’t—and that’s your edge.
Sources
- U.S. Census Bureau – Rental Housing Statistics - Provides data on rental vacancy rates and housing trends for understanding local market conditions
- Federal Reserve – Selected Interest Rates (H.15) - Current and historical interest rate data to model realistic financing scenarios
- HUD – Local Information and Resources - Links to state and local housing authorities, including landlord-tenant regulations and assistance programs
- National Association of Realtors – Research & Statistics - Market reports and data on home prices, rents, and broader housing trends
- BiggerPockets – Rental Property Analysis Guides - Practical frameworks and examples for underwriting rental properties and calculating key metrics